R-Graphics Crash Course
 Image credit: R
Abstract
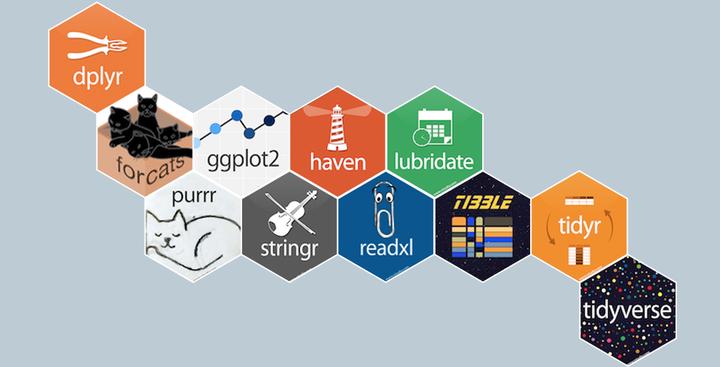
This talk will enable you to use R to easily visualize data and create publish-standards plots. All the codes and examples are free to download and welcome to revise. We will cover ggplot and its derivative packages in this 2 hr long talk, and it will give you an intuitive knowledge of plotting.
Date
Nov 13, 2021 7:30 PM — 9:30 PM
Event
R-Graphic Crash Course
Location
Zhihua Building B 340
Xuefu Ave 999., Nanchang, CN 330031
Follow the pre-requisition below to ensure you could follow the steps.
Pre-requisition:
- 下载并安装 R语言程序包,选择自己对应的操作系统下载。
- 下载并安装RStudio,选择Desktop版本。
- 浏览Tidyverse Package网页,并尝试使用install.packages(“tidyverse”)指令安装Tidyverse Package.
- 浏览本课程将复现的论文图片